Pivot Tables are the perfect solution for summarising data in a spreadsheet. As the name suggests, your data can be pivoted at the touch of a button, which makes them a genuinely fast, reliable and versatile way to build a report.
Creating one
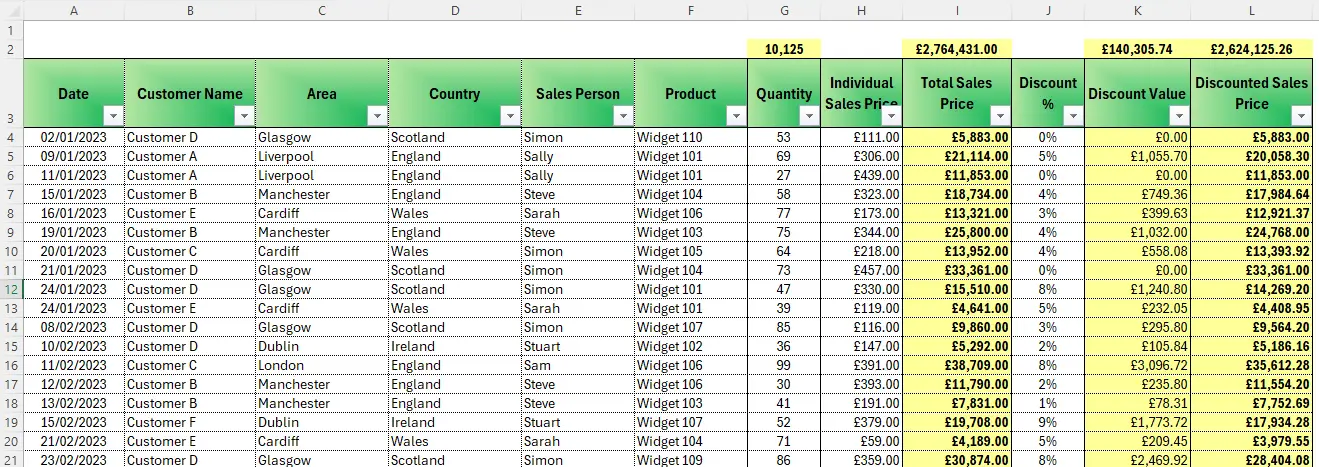
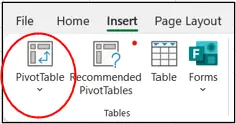
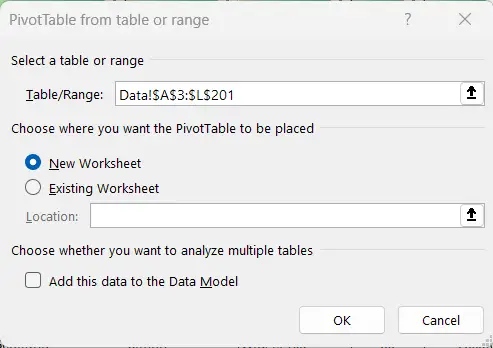
Select all of the data your Pivot Table should be based on (I’d always recommend using a Named Range here, see my blog on those), making sure none of the cells in the first row are blank, since that row becomes your list of available fields. From the Insert ribbon, choose PivotTable, confirm your range and where you’d like it placed, and you’ll get an empty grid alongside a field list on the right.
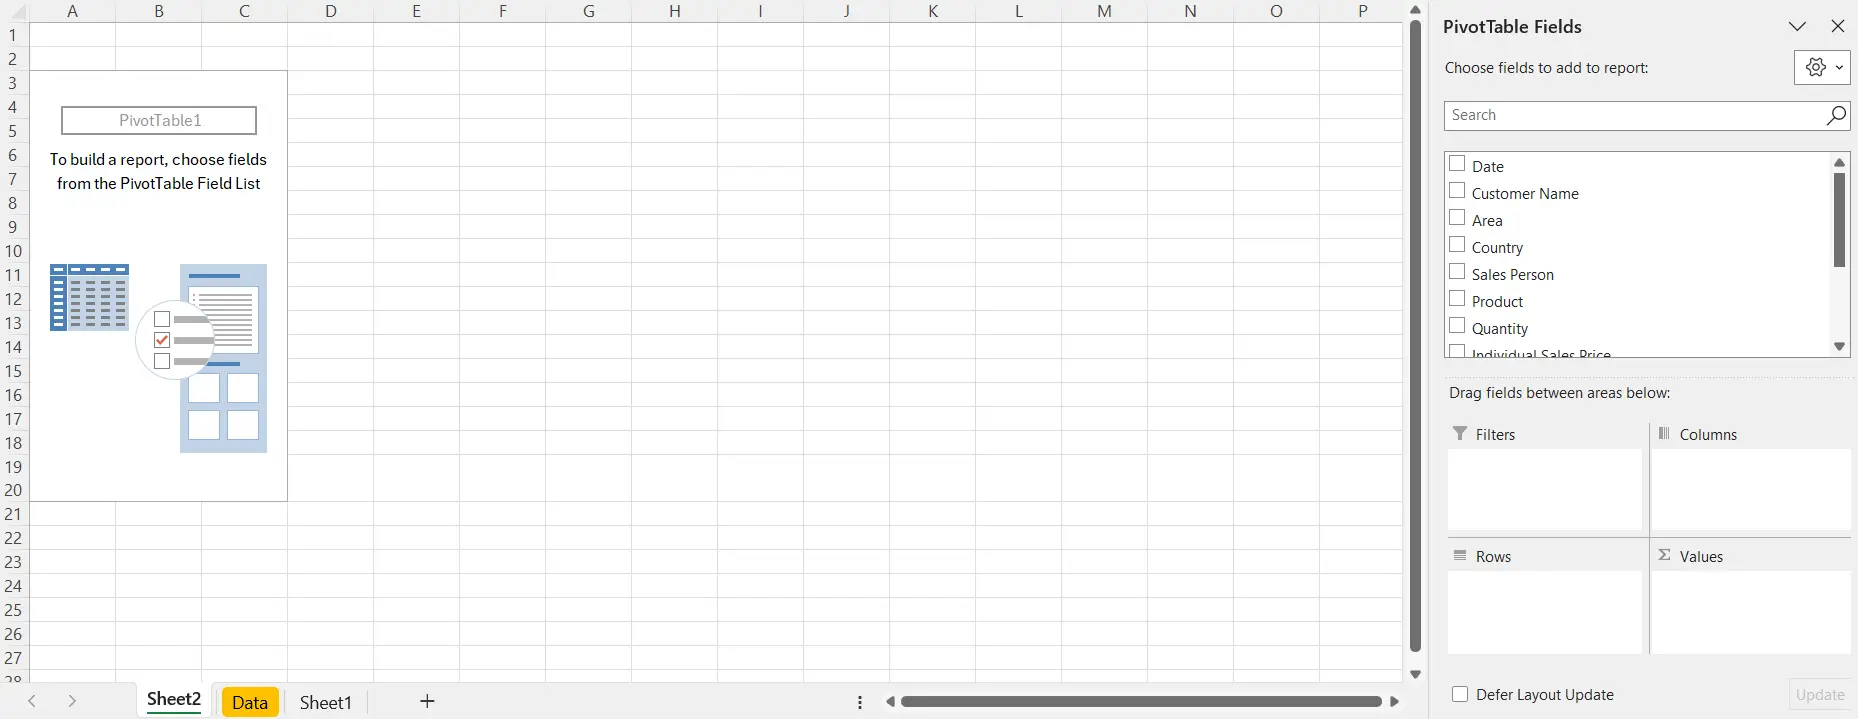
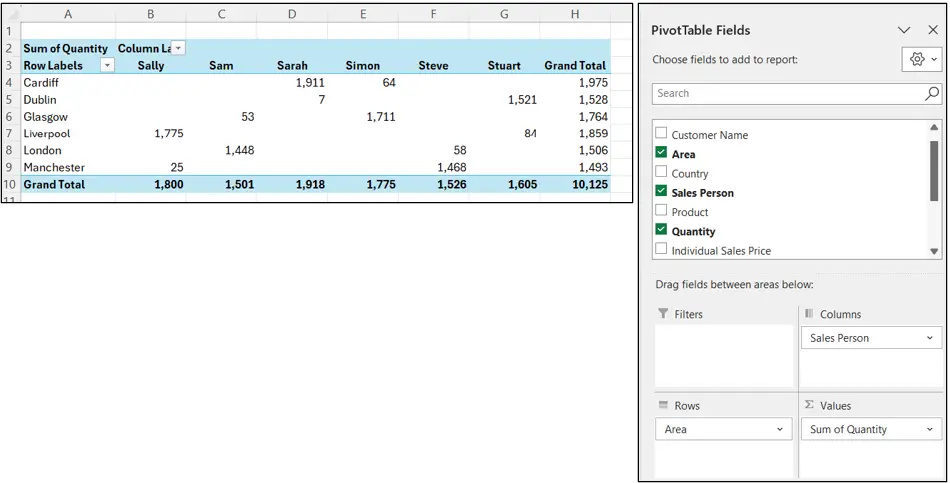
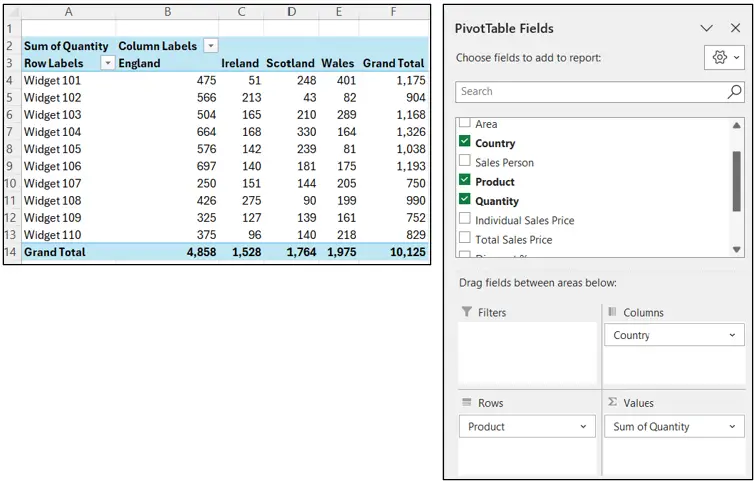
From there it’s simply drag and drop.
Filter gives you a filter for the whole report
Columns adds a column for each field you drop in
Rows adds a row for each one
Values is where the actual calculation happens (sum, count, average, and so on). There’s no fixed right answer for which box to use, it depends entirely on the summary you’re trying to build and your data, but it really is just a case of dragging fields around until it looks right.
Keeping it up to date
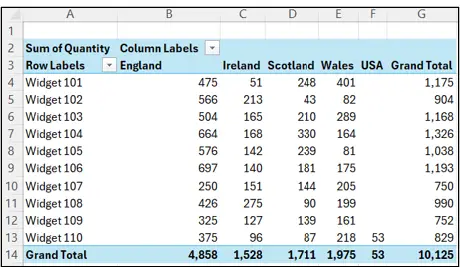
The real beauty of a Pivot Table is that when your raw data changes, you simply right click anywhere on it and choose Refresh, and everything updates instantly. Change any data in the report and the whole summary rebuilds and recalculates itself in seconds, no formulas to rewrite.
Formatting
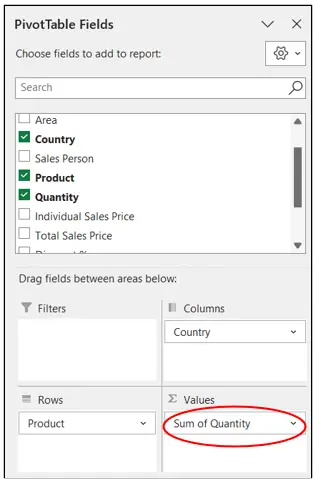
If you need to format the numbers shown, format the field itself (right click the field, Value Field Settings) rather than the physical cells, since field formatting stays applied no matter how the layout changes later.
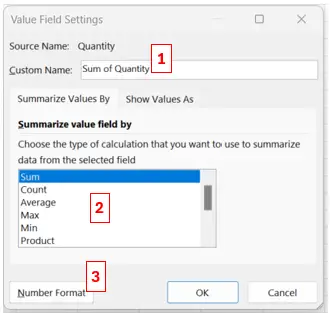
The Design ribbon also gives you a whole range of built in Styles to make the report look properly professional.

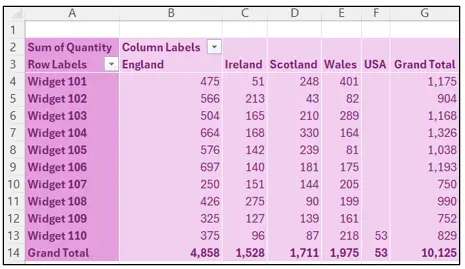
A couple of things worth knowing
There’s no limit to how many Pivot Tables you can build in one file, and they can even live in a separate file from the raw data, handy if you want to share a clean summary without handing over the whole working file. Just bear in mind it may still be possible to drill down and see more detail than you intended, so if you’re sharing something sensitive, either protect the sheet or save it as a PDF instead.
At first glance Pivot Tables can look intimidating, but the drag and drop simplicity means you can play about with them freely, without ever touching your actual raw data underneath.